You are here
Traffic mirroring with MariaDB MaxScale
Thu, 2020-12-24 16:27 — Shinguz
Recently we had the case that a customer claimed that MariaDB 10.3 Binary Log is using 150% more space on disk than MySQL 5.7 Binary Log. Because I never observed something similar, but to be honest, I did not look to intensively for this situation, we had to do some clarifications.
First we checked the usual variables which could be candidates for such a behaviour:
binlog_format                = ROW
binlog_row_image             = FULL
binlog_rows_query_log_events = OFF   # MySQL only
binlog_annotate_row_events   = OFF   # MariaDB equivalent
log_bin_compress             = OFF   # MariaDB only
Those were all equal on MariaDB and MySQL. So is was not a trivial case to solve.
The customer did not like the suggestion to just increase the disk space. So we had to dig further...
In the MariaDB Enterprise support ticket we have noticed that the MariaDB support engineer tried to use MariaDB MaxScale to reproduce our problem (without success by the way). So time to try it out ourself because we have some other scenarios where this could be useful as well.
Installation
For our test set-up we were using MariaDB MaxScale version 2.5.6:
shell> maxscale --version
MaxScale 2.5.6
The MariaDB MaxScale version seems to be quite important because MariaDB changed a lot in MaxScale in the past and it is not always backwards compatible!
Because MariaDB does not provide binary tar-balls for MaxScale we extracted them ourself from the DEB packages. To make it work we have to set the LD_LIBRARY_PATH and the PATH environment variables:
shell> BASEDIR='/home/mysql/product/maxscale'
shell> export LD_LIBRARY_PATH=${LD_LIBRARY_PATH}:${BASEDIR}/lib/x86_64-linux-gnu/maxscale
shell> export PATH=${PATH}:${BASEDIR}/bin

shell> maxscale --help
Configuration
MariaDB MaxScale documentation is not really complete and some actual and good examples are missing a bit. So we had to do some experiments. After these experiments we came to a configuration which worked well for our case (please let me know if there are better ways to do it):
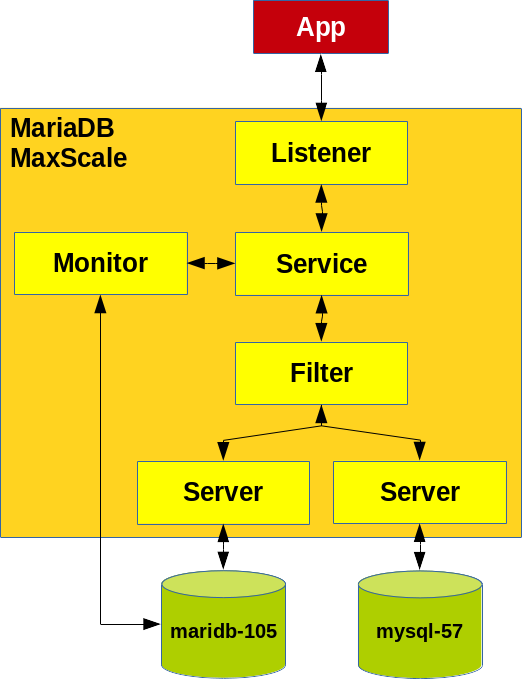
#
# /home/mysql/etc/maxscale_load_split.cnf
#

[Load-Split-Listener]
type=listener
service=Split-Service
protocol=MariaDBClient
address=0.0.0.0
port=3392

[Split-Service]
type=service
router=readconnroute
servers=mariadb-105
filters=TeeFilter
user=maxscale_admin
password=secret

[TeeFilter]
type=filter
module=tee
target=mysql-57
match=/.*/
# exclude=/truncate*/

[Monitor]
type=monitor
module=mariadbmon
servers=mariadb-105,mysql-57
user=maxscale_admin
password=secret
monitor_interval=60000

[mariadb-105]
type=server
address=192.168.1.108
port=3357
protocol=MariaDBBackend

[mysql-57]
type=server
address=192.168.1.108
port=3320
protocol=MariaDBBackend
Caution: This configuration probably only works for MaxScale 2.5 and newer. For details see: [ 2 ].
Starting MariaDB MaxScale
First we did a check of the configuration file:
shell> maxscale --nodaemon --config=/home/mysql/etc/maxscale_load_split.cnf \
--log=stdout --libdir=${BASEDIR}/lib/x86_64-linux-gnu/maxscale \
--persistdir=/home/mysql/tmp --datadir=/home/mysql/tmp --logdir=/home/mysql/log \
--piddir=/home/mysql/tmp --cachedir=/home/mysql/tmp/cache \
--config-check
Here we hit a bug. Or at least a bug in my opinion. But MariaDB support decided, that it is not a bug: [ 7 ]. Then we started MariaDB MaxScale:
shell> maxscale --nodaemon --config=/home/mysql/etc/maxscale_load_split.cnf \
--log=stdout --libdir=${BASEDIR}/lib/x86_64-linux-gnu/maxscale \
--persistdir=/home/mysql/tmp --datadir=/home/mysql/tmp --logdir=/home/mysql/log \
--piddir=/home/mysql/tmp --cachedir=/home/mysql/tmp/cache
Creating users
Then we found out (it was not very well documented) that we need a user for MaxScale with the following privileges:
SQL> CREATE USER 'maxscale_admin'@'%' IDENTIFIED BY 'secret';

SQL> GRANT SELECT ON mysql.user TO 'maxscale_admin'@'%';
SQL> GRANT SELECT ON mysql.db TO 'maxscale_admin'@'%';
SQL> GRANT SELECT ON mysql.tables_priv TO 'maxscale_admin'@'%';
SQL> GRANT SELECT ON mysql.roles_mapping TO 'maxscale_admin'@'%';
SQL> GRANT SHOW DATABASES ON *.* TO 'maxscale_admin'@'%';

SQL> GRANT SELECT ON mysql.columns_priv TO 'maxscale_admin'@'%';
SQL> GRANT SELECT ON mysql.procs_priv TO 'maxscale_admin'@'%';
SQL> GRANT SELECT ON mysql.proxies_priv TO 'maxscale_admin'@'%';
And we also need an application user for doing the tests:
SQL> CREATE USER 'app'@'%' IDENTIFIED BY 'secret';
SQL> GRANT ALL ON test.* TO 'app'@'%';
Testing and observations
We were running some simple manual tests, than our famous insert test and last our new mixed test. On the first look it looks like everything was working fine. The load was split on both servers (I checked with the General Query Log) and they executed all the queries simultaneously. I knew that the second server was configured in a way it was processing the queries slower than the first one and thus I was wondering what happens.
If one back-end is lagging, in our case it was lagging more than 450 seconds, we found that the disconnect was not done properly. Then we found, that some rows were missing. So it seems like we have some Statement Cache overflow.
On the main instance (mariadb-105):
SQL> SELECT COUNT(*) FROM test.test;
+----------+
| count(*) |
+----------+
|   221056 |
+----------+
The General Query Log looks as follows:
...
3655 Query    INSERT INTO test (id, data, ts) values (NULL, "Test data insert", CURRENT_TIMESTAMP())
3655 Query    INSERT INTO test (id, data, ts) values (NULL, "Test data insert", CURRENT_TIMESTAMP())
3655 Quit
On the tee'd instance (mysql-57):
SQL> SELECT COUNT(*) FROM test.test;
+----------+
| count(*) |
+----------+
|   190466 |
+----------+
The General Query Log looks as follows:
...
2020-12-24T08:19:24.497319Z      4322 Query     INSERT INTO test (id, data, ts) values (NULL, "Test data insert", CURRENT_TIMESTAMP())
2020-12-24T08:19:25.430806Z      4322 Query     INSERT INTO test (id, data, ts) values (NULL, "Test data insert", CURRENT_TIMESTAMP())
So we lost about 30k rows on the tee'd instance!!! And this without any error or warning. For this behaviour we filed a bug [ 4 ]. And thus this feature is not usable for production IMHO atm. If somebody has a solution for this, please let me know (documentation did not state anything).
Beside of loss of data we further found, that the data were not 100% equal. Because the statements are routed asynchronously it can be, that some statement are executed at different times:
On the main instance:
| 910 | Test data insert | 2020-12-24 09:23:36 |
On the tee'd instance:
| 910 | Test data insert | 2020-12-24 09:23:37 |
One second difference! We did not investigate further... Other functions like RAND(), NOW(), etc. will behave similarly.
When we throttled the pace from 10 µs sleep between statements to 10 ms between statements we have not seen losses any more (number of rows and checksum was correct). But we cannot know for sure (because no warnings).
What about the original Binary Log problem?
We have not observed the described behaviour with a mixed INSERT, UPDATE and DELETE workload:
On the main instance:
| chef_mariadb-105_binlog.000103 | 3017223 |
On the tee'd instance:
| chef_mysql-57-binlog.000601 | 4633484 |
In contrary: the MySQL Binary Logs were about 50% bigger than the MariaDB Binary Logs. So our customer must have hit a special query pattern where MariaDB behaves worse related to Binary Log size than MySQL.
Literature
- 1 MXS-1267: Refactor tee filter
- 2 MXS-2029: Tee directly to backend server
- 3 MXS-16: Tee filter: statement router loses statements when other router gets enough ahead
- 4 MXS-3353: tee filter looses statements without any warning
- 5 ProxySQL Mirroring
- 6 Tee Filter
- 7 MXS-3349: maxscale does not consider log location
Taxonomy upgrade extras:
- Shinguz's blog
- Log in or register to post comments
Comments
Use Mirror Router instead
I just got a note from Markus Makela with the following suggestion:
You could try and see if the mirror router from the experimental module package would work as a substitute for this.